Recently the Zooniverse launched the eighth season of the Snapshot Serengeti project with 362,000 new subjects from the automated camera traps in the Serengeti national park in Tanzania.
The really cool thing about the new season is that there is a new piece of code (named Geordi after the Star Trek character) which collects information about the actions of our volunteers taken on the site, e.g. what buttons they click, how long they spend viewing an image, when they decide to leave the site etc. Here is an example of some of the data Geordi is collecting.
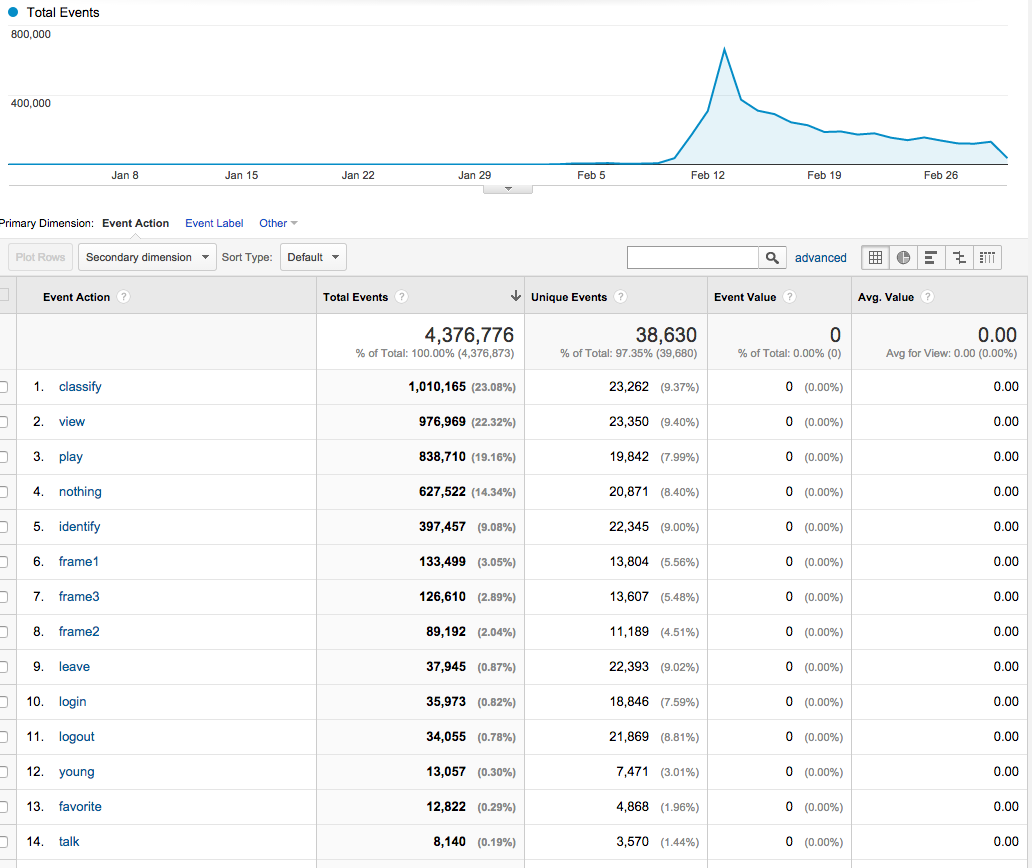
User Analytics Events captured by Geordi during Snapshot Serengeti Season 8 launch
One of the goals for the MICO work on the Zooniverse platform is to use image extraction, textual analysis, and recommendations to create a workflow that will improve the user experience on projects like Snapshot Serengeti. Geordi is a first step that allows us to build a profile for each user, which we can then use to make decisions on what might improve their experience. For example, if someone seems to really like pictures of zebras, then perhaps we can increase the frequency with which they see images containing zebras, or they could be guided to areas of the forum where other volunteers are discussing zebras.
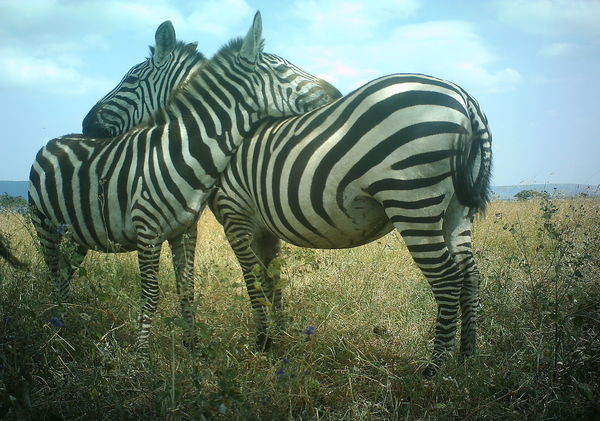 By analysing the data Geordi collects, we can build up a user profile about a certain user’s interest – for example if they have favourited a lot of images containing zebras, shared them on social media or talked about them on our discussion boards, we can now add “likes zebras” to that user’s profile.
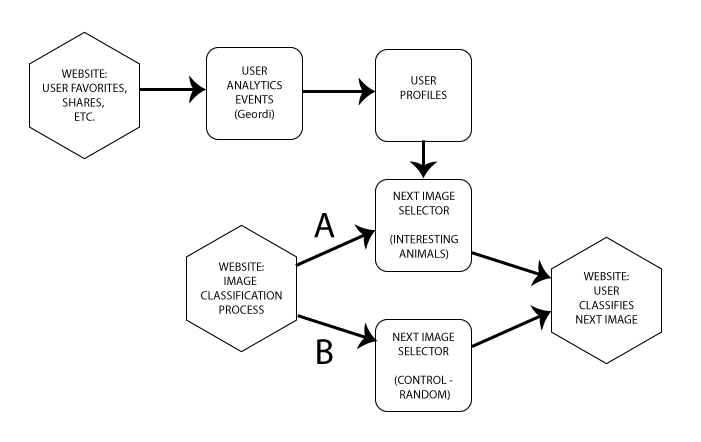
Experimental Framework for Interesting Animals Experiment
The next part of the experiment comes when deciding what image to offer to that user for classification next. We will randomly split users into two partitions – a control group which will still be given a random image (B), and an “interesting animal” group, for whom we will calculate an image that is more likely to match their preferences, based on the user profile we have built up for them (A). (This is where the recommendation engine, part of the MICO platform, comes in). We will then measure and compare how the two groups behave – for example, do those in group A spend longer on the site, or interact more deeply with the images, than group B.
Most importantly, we want to establish whether small changes like these can have a measurable, positive effect on the behaviour of the volunteer, leading to a richer user engagement and a better quality, and quantity, of data.